
Note: The following post is current as of WHO report of 09-18-14, which includes data to 09-14-14. [I’ve altered this code a number of times because of the nearly constantly changing format and location of the WHO data.]
#######
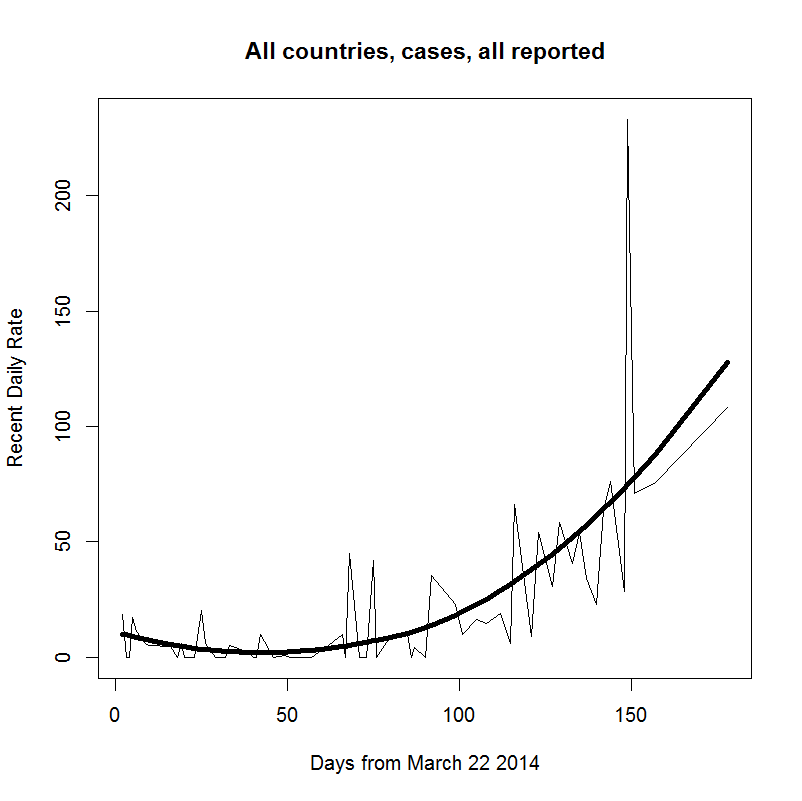
I wanted to find certain statistics for the West African Ebolavirus (EBV) outbreak from its inception, e.g. recent case and death rates. By “recent” I mean at WHO GAR reporting intervals, typically a few days. But the sites where I’d expect to find such (WHO, CDC etc) didn’t have them, at least in a synthesized form. So, I wrote an R script to scrape, compile, rearrange, and plot the data, for any country or all together, as taken from two sources. Starting with the WHO July 1 GAR report, tables of new and cumulative cases and deaths, categorized by degree of certainty, for each of the three countries in the outbreak, are given. Wikipedia has a less detailed table for all dates from March 25 on. I used it to obtain total cases and deaths up to July 1.
Below are graphs of the recent, per-day (1) case rates, and (2) death rates, from March 22. Each shows the raw data (thinner line), and a loess-fitted trend (thicker line). Note that reporting issues are partly, perhaps largely, responsible for extreme fluctuations in the raw data.

library(XML);library(chron);library(gdata)
rm(list=ls())

## set working directory containing data table (as "ebola data.csv")
setwd("")

## 1. Read data table:
options(stringsAsFactors = FALSE)
EBV = read.csv("ebola data.csv",header=T)
EBV[,4:7] = as.integer(unlist(EBV[,4:7]))
colnames(EBV) = c("Country", "Date", "Type", "C", "P", "S", "CPS")
for (i in 1:3) EBV[,i] = trim(EBV[,i])
EBV = EBV[order(EBV$Country, EBV$Type, EBV$Date),]
EBV$Date = as.Date(EBV$Date)
str(EBV)

## 2. Compute new cases from differences, compute time in days from first report (March 22)
dates = unique(EBV$Date); n.dates = length(dates); t1 = dates[1]
EBV$T.sum = as.integer(EBV$Date - t1)
EBV$dCPS = c(NA, diff(EBV$CPS)); EBV$dC = c(NA, diff(EBV$C)); EBV$dT = c(NA, diff(EBV$T.sum))
temp2 = rep(NA, nrow(EBV))
for (i in 2:nrow(EBV)) {if (EBV$Type[i] != EBV$Type[i-1]) temp2[i] = 1}
EBV$dCPS[temp2==1] = NA; EBV$dC[temp2==1] = NA; EBV$dT[temp2==1] = NA
EBV$rCPS = EBV$dCPS/EBV$dT; EBV$rC = EBV$dC/EBV$dT

## 3. Compute and plot recent (since last update report) daily case and mortality rates for given country and case type
# a) compute
strata = expand.grid(sort(unique(EBV$Country)), sort(unique(EBV$Type)), stringsAsFactors=F); strata
pick = which(strata[,1]=="All countries")			# choose desired country; from names given in strata
stiff = 1; flex = 1/2
i = pick[1]

 subset1 = EBV[which(EBV$Country==strata[i,1] & EBV$Type==strata[i,2]),][-1,]
 subset2 = subset1[-(1:21),c(8,12)]; rownames(subset2) = 1:nrow(subset2)
 smooth1 = loess(subset1$rCPS ~ subset1$T.sum, span=stiff)[[2]]
 smooth2 = loess(subset2$rCPS ~ subset2$T.sum, span=stiff)[[2]]

 mn = smooth2[which(smooth2==min(smooth2))];  mx = smooth2[which(smooth2==max(smooth2))]
 (diff = mx-mn); subset2[,1] = subset2[,1] - min(subset2[,1]) + 1
 (days = max(subset2[,1]))
 (x = diff^(1/days)); x^days; log(x)
 (tests =  exp(seq(0.5*log(x), 1.5*log(x), length.out=201)))
 testing = matrix(NA, nrow=nrow(subset2), ncol = length(tests))
 for (j in 1:ncol(testing)) testing[,j] = tests[j]^subset2[,1]

 a = (testing - subset2[,2])^2
 b = apply(a,2,sum)
 (daily.spread = tests[which(b==min(b))])
 (weekly.spread = daily.spread^(6:12))

# b) plot, with loess smoothing, reported cases and deaths, (except WHO-reported "New" cases)
 for (i in pick){
 subset3 = EBV[which(EBV$Country==strata[i,1] & EBV$Type==strata[i,2]),][-1,]
 smooth3 = loess(subset3$rCPS ~ subset3$T.sum, span=stiff)[[2]]
 windows()
 plot(subset3$T.sum, subset3$rCPS, type="l",
  xlab = "Days from March 22 2014", ylab = "Recent Daily Rate",
  main = paste(strata[i,1], tolower(strata[i,2]), "all reported", sep=", "))
  lines(subset3$T.sum, smooth3, lwd=4)
  print(smooth3)
}

I’ve been trying to follow this outbreak in Promed Digest and it is a bit depressing how the initial outbreaks were not isolated and controlled. Still, in its wild form (as opposed to whatever more vagile mutants that may have been developed in various biowarfare labs), the Ebola viruses are not highly contagious and they are not likely to start a pandemic. I think this one has gotten out of control mostly because it is new to the region and some governments have been trying to play down the problem (e.g. by only reporting laboratory confirmed cases vs suspected cases) and a general distrust of the government in rural populations (probably usually well deserved).
We have several bat-reservoir viruses that are similarly lethal here in Australia and, unfortunately, the locals response isn’t much better. For example, Hendra Virus is thought to be transmitted from fruit bats to horses via saliva-infested fruit remnants that horse eat. When horses get sick the vets and owners that inspect them can be infected and often die. A vaccine is available for horses, but it is expensive and has to be administered periodically. There is some indication that some vets jack-up the price of the vaccination program and the government just dithers around neither requiring vaccination nor supporting its cost. Fewer people die here, but we still haven’t been able to control it.
Bats tend to cluster in large groups and so are a paradise for parasites. White-nose syndrome is currently depleting populations of bats in North America, but once they adapt to it, they will probably rebound and remain a reservoir of the pathogen for any other group that might get infected. This is all moderately scary, but I think if I lived in the US I’d spend my time worrying about dengue, chikungunya, and yellow fever. Failures in vector control have allowed the mozzies that transmit these diseases to become re-established in large areas in the SE US (also in some areas of Australia) and all of these viruses have human reservoirs, i.e. all it takes to start an outbreak is to have someone with the disease to move into an area and feed the mozzies. Ditto for malaria (although the vectors are ‘naturally’ endemic). A few hundred thousand people getting chikungunya and a few dozen dying in the Caribbean this year may not seem like much, but it is a bad sign.
Lot of good stuff there Dave. Here’s a good article, just out, describing some of the social problems contributing to the problem in Sierra Leone. I read somewhere else that another contributor to this outbreak is the much better road system and mobility of the population compared to previous outbreak areas, like the Congo and Uganda. And the novelty in this area, which you mention.
Agreed on the potential for pandemic being limited, and globally a number of infectious diseases are much more important than this. EBV as a global pandemic is not a big concern for me, but regionally or throughout central Africa it most definitely is. Also, what EBV lacks in ease of transmission, it makes up for in virulence. The mortality rates are staggering, we’re talking 60 to 80 percent generally.
See also this article from a few years back.
Hi, I’m searching for graphs showing cases per day rates by country, and it sounds like what you’ve produced might do that, but I’ve no idea what to do with it. Do you know any where I can see this? Any help much appreciated – I work with an aid agency and we’re trying to get decent visual representations to understand trends and respond.
Thanks,
Cat
Hi and thanks for writing. As far as I can determine, it is not possible to get the actual numbers of cases and deaths for each particular day, if that’s what you mean. This is because the WHO and/or CDC are not making them available, assuming they have them. One has to approximate the daily rate by interpolating the values given between each report; the dark black line in the graph is that interpolation.
I’ll put up new graphs and the per-country numbers later if that’ll help you. Just give me a yea or nay.
Pingback: Updated Ebola outbreak data | Ecologically Orientated
Pingback: RedTrack.ME
Pingback: Ebola Deaths Go Exponential As Nigeria Demands Experimental Drug From US - UNCLE - UNCLE
Pingback: 전세계의 최신 영어뉴스 듣기 - 보이스뉴스 잉글리쉬
Pingback: Ebola Deaths Go Exponential; Nigeria Demands Experimental Drug From US, Saudi Death First In Arab World - The Daily Rapid
Pingback: Ebola Deaths Go Exponential; Nigeria Demands Experimental Drug From US, Saudi Death First In Arab World | Zero Hedge | Olduvaiblog
Pingback: Ebola epidemiology data scraper | Ecologically Orientated | wwlee4411
Pingback: RedTrack.ME
Pingback: French Government Denies Report Of "Several Ebola Cases"; Outbreak Accelerates At Fastest Pace Yet - UNCLE - UNCLE
Pingback: 전세계의 최신 영어뉴스 듣기 - 보이스뉴스 잉글리쉬
Pingback: French Government Denies Report Of "Several Ebola Cases"; Outbreak Accelerates At Fastest Pace Yet - Techhic
Pingback: Ebola Cases Surge At Record Pace As Death Toll Hits 1,145 - UNCLE - UNCLE
Pingback: Ebola Cases Surge At Record Pace As Death Toll Hits 1,145 | Zero Hedge | Olduvaiblog
Pingback: Ebola Cases Surge At Record Pace As Death Toll Hits 1,145
Thanks for posting the charts.
I assume by “rate” you mean deaths per “day(period)” on the vertical axis. Perhaps “deaths per day” would then be a simpler label, if so.
I would like to see the graphs by country mentioned by Cat as well as the totals. According to the medical staff of Samaritan’s Purse congressional testimony, the WHO numbers are probably something like 25 – 50% of the reality.
Correct, y axes are cases or deaths per day.
Liberia is in the most serious trouble–with graphs that approximate the shape of those shown here, (worse actually). Sierra Leone is somewhat better but still volatile, and in Guinea, where it started, it’s been quite stable–just a few cases and deaths per day over the past 2-3 weeks.
Regarding the accuracy of the WHO numbers, I desperately hope they are not as low as you mention there, but only the on-the-ground folks have any real feel for that. It seems possible, given what I’ve read about how afraid some of these people are about going to the clinics, which they feel is akin to a death sentence. Such a tragedy.
Here is the link for the testimony so you can draw your own conclusions. Ken Isaac’s and Frank Glover’s (at bottom) reflect their first hand experience with the outbreak. They decided to pull out all their people for cause. Well worth a read of their short statements (PDF) to congress to get a feel for the true situation.
Completely horrifying situation in Monrovia as elsewhere and certainly something that might have been controlled with more effort (with teeth needed) in it’s initial stages.
Now it’s a textbook example of a disease outbreak exponential progression. The lack of current effective quarantine measures reflect poorly on the future outlook.
http://foreignaffairs.house.gov/hearing/subcommittee-hearing-combating-ebola-threat
Pingback: Ebola Cases Surge At Record Pace As Death Toll Hits 1,145 - Techhic
The points above about modes and ease of transmission need some updating. There is no doubt that “droplet” transmission is possible and likely, as indicated by the CDC (see footnote at bottom).
http://www.cdc.gov/vhf/ebola/hcp/case-definition.html
Likewise, I see no reason why secondary (as opposed to “direct”) viral-particle-in-body-fluid transfer from surfaces and by housefly type insects would not transmit the disease. Prior studies have shown the virus can survive outside the body for several days within the usual limitations (UV exposure, etc).
I see way too much effort in misdirection and to suppress info in the name of “avoiding panic”.
I’ve had some of the same questions regarding possible modes of transmission. But then, everyone does–it’s one of the first questions one needs to ask. I think the terminology could be clearer.
It seems to me that this is a case where no finger pointing is warranted. It sort of is what it is, which tragically, is a nightmare. There’s a very fine line here between inducing panic and glossing over real problems it seems to me. I think they (WHO) know this and are doing their best to avoid either. That situation is as serious as you can get–people are terrified there and you don’t want to make it worse there at ground zero.
Pingback: Estimating the spread rate in the current ebola epidemic | Ecologically Orientated
Pingback: WHO Worker Ebola Infections Mount: Sierra Leone Lab Shut, Senegal Doctor Flown To Hamburg - UNCLE - UNCLE
Pingback: Today’s News August 27, 2014 | The One Hundredth Monkey
Pingback: WHO Worker Ebola Infections Mount: Sierra Leone Lab Shut, Senegal Doctor Flown To Hamburg - The Daily Rapid
Pingback: WHO Worker Ebola Infections Mount: Sierra Leone Lab Shut, Senegal Doctor Flown To Hamburg | Centinel2012